* The content is for informational purposes only, you should not construe any such information or other material as legal, tax, investment, financial, or other advice.
By Otakar Korinek, Jeffrey Zhang, Kevin Zhang
Company Overview
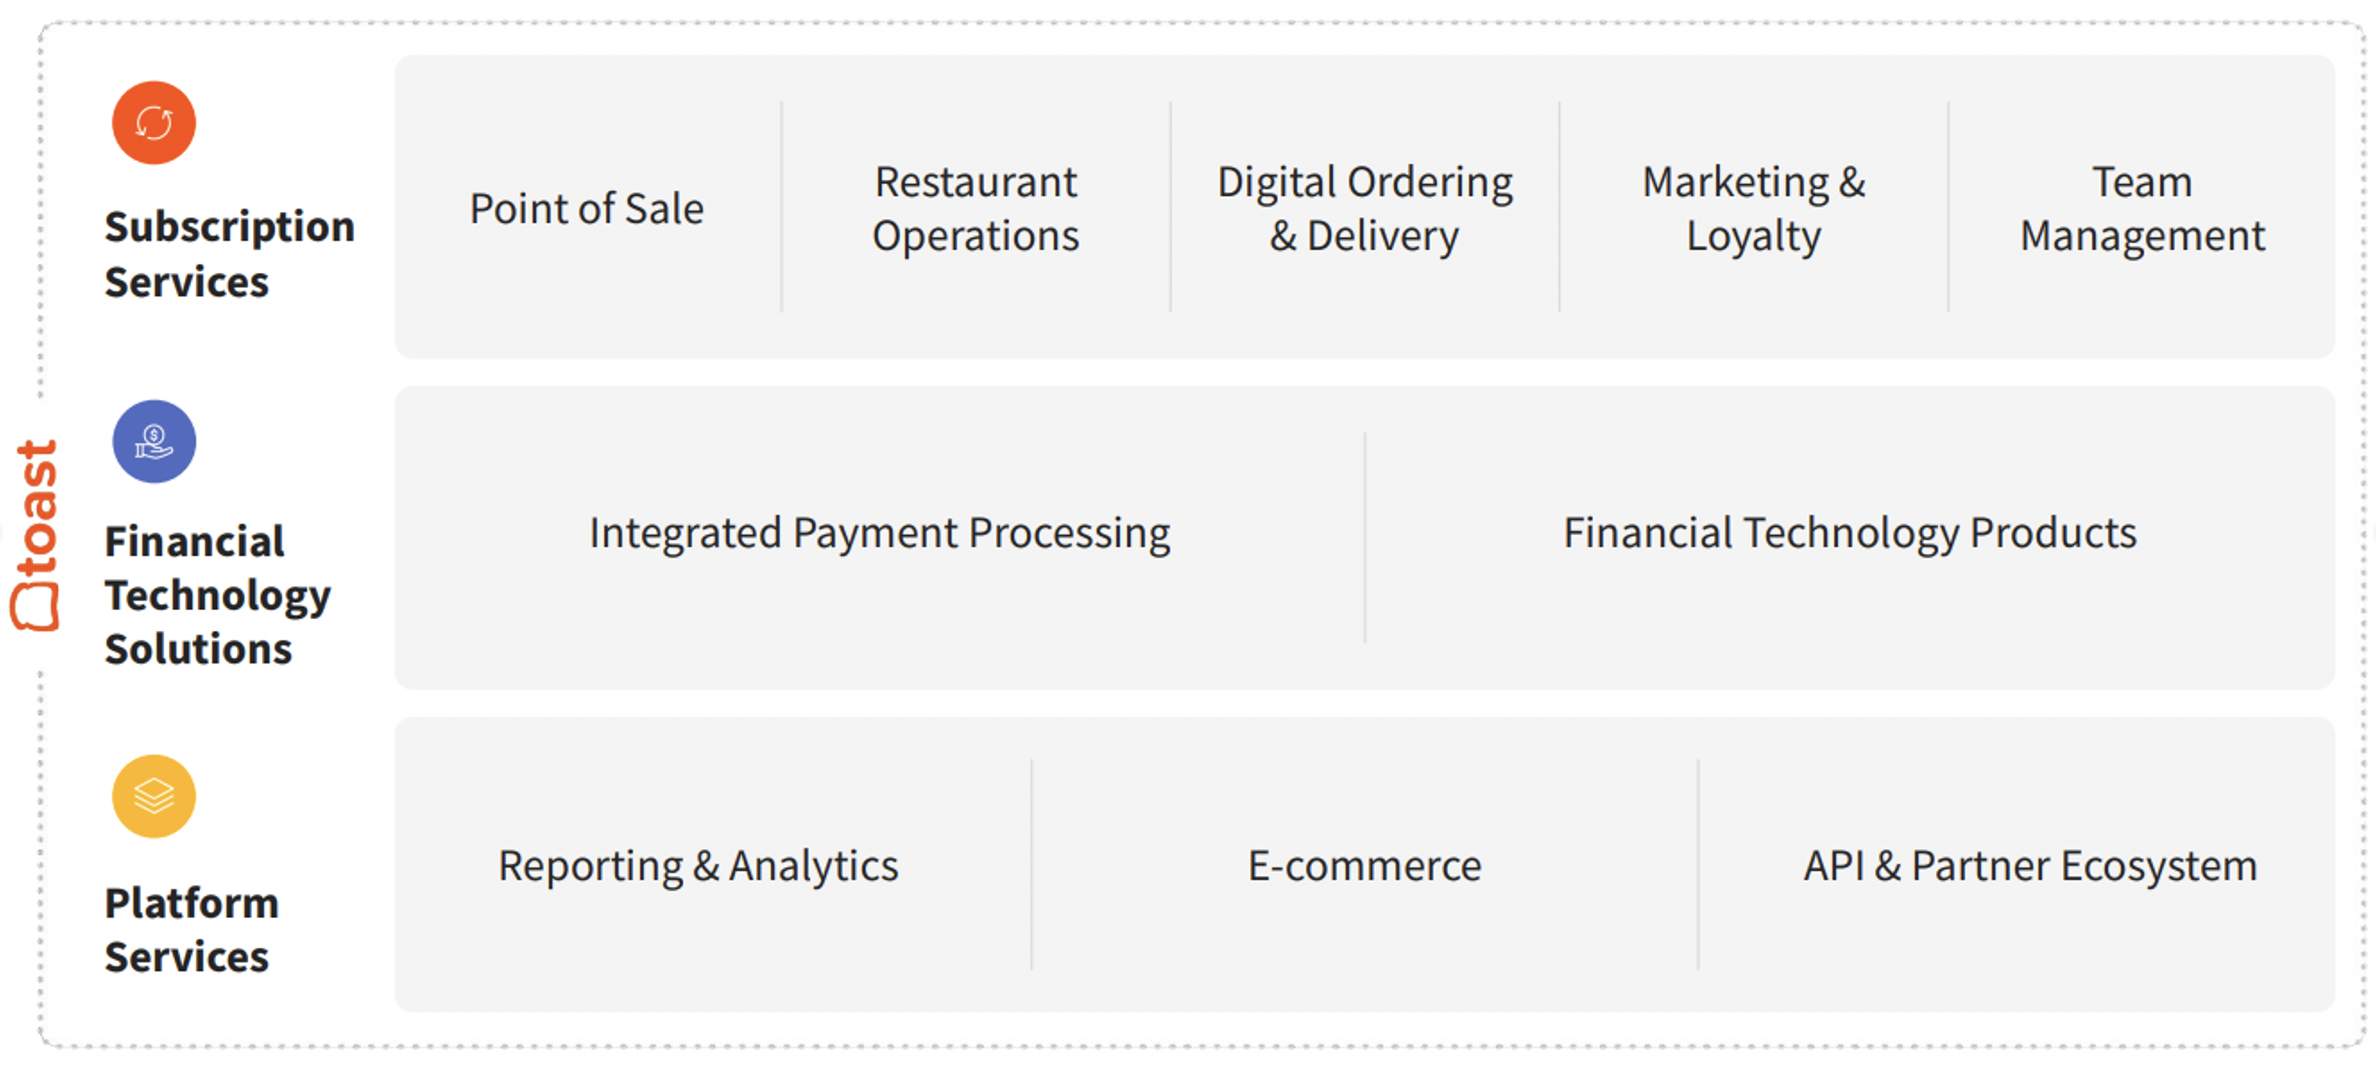
Toast is a cloud-based, all-in-one digital tech platform for the entire restaurant industry. The platform offers services such as reporting and analytics on real-time sales, menu, and labor data, as well as Toast Partner Connect and APIs to customize the tech stack from a portfolio of 160 partners. Additionally, the company offers subscription services such as order and pay from mobile/OTC, card reader, kitchen display, multi-location management, online ordering/takeout services, and marketing insights.
Figure 1 - Toast Product Offering
Toast has four primary revenue vertices: subscription services (32.6% of gross profit, 29% of revenue), fintech solutions (83.6% of gross profit, 49% of revenue), hardware (-11.4% of gross profit, 19% of revenue), and professional services (-7.9% of gross profit, 3% of revenue). Key drivers of ARR include locations and ARPU.
Figure 2 - Toast ARR Growth
Industry Overview
The foodservice and restaurant industry is valued at around $860 billion in GPV in 2021, and Toast's global TAM is estimated at around $50 billion, which is at least twice as large as the domestic TAM. The US TAM for the restaurant industry's annual spending on technology is around $25 billion, or 2.7% of sales, while the SAM for Toast is estimated at around $15 billion. This implies around $17.5k in revenue per restaurant location.
The US restaurant POS market is highly fragmented, with only 24% of locations using cloud based POS systems. However, with POS systems having a typical lifespan of around 6 to 8 years and a recent upgrade cycle in 2015, there is an increased incentive for restaurant owners to switch to cloud-based solutions post-2022. Toast has a distinct advantage in this market, thanks to its low upfront costs for hardware and professional services, as well as its flexibility and functionality. The Capterra POS survey shows that ease of use (28%), functionality (27%), and price (20%) are the main considerations for POS purchases. Additionally, Toast has market leading win rates, driven by its less painful switching process with discounted hardware and services, compared to its competitors.
Figure 3 - Market Share in Restaurant PoS
Our 2 Core Theses
Undervalued growth opportunities both structurally in restaurant industry and idiosyncratically through Toast’s go-to-market strategy
Underestimated terminal recurring TAM
Superior product and focus on restaurants helps Toast win head-to-head for customers
Payroll addon leading to higher ARR opportunities, and missed opportunities in switch towards CNP payments leading to underestimate take rates
StratEx acquisition highly accretive to ARR
Toast has substantial room for take rates increases
1.1 Toast’s terminal recurring TAM is grossly underestimated
The restaurant industry spends just 3% of revenue on IT, compared to 5% economy-wide, creating a huge annual market opportunity for Toast.
Figure 4 - The Restaurant industry is under-spending on IT
Roughly 60k restaurants open per year due to both fresh openings and churn within the industry. This allows for 60k new restaurants per year in POS demand. The average lifespan of a POS system is 7-8 years, creating so 10-15% of restaurants per year forced to replace systems. Due to the high natural churn rate, it creates consistently high annual TAM. In actuality, 60k + 12.5% x 600k = 135k restaurants per year open to POS replacement.
Toast services 74k restaurants (42% YoY growth), but this is only 10% penetration of the TAM of ~860k restaurants in the US. The SAM of ~600k restaurants (excluding chains) is the primary target for Toast, which is small-sized restaurants. Restaurant subscriptions ARR is ~$3K. Given 3% spending on IT, it implies ~$100k annual sales in restaurants. Roughly 1.6 Toast locations per customer, implying that Toast is serving the lower end of the restaurant spectrum. This
results in faster acquisition (only must convince the owner), higher stickiness, and higher margin payment processing (0.8-1.2% net yields vs 0.01-0.1%).
Figure 5 - Toast's Target Market
Thesis 1.2: Superior growth model and superior product
Currently, legacy POS systems like MICROS and NCR Aloha hold over 50% market share. Toast differentiates itself with its Go-to-market Strategy. Legacy POS systems have a clunkier, outdated product with no sophisticated OS or add-ons. In Tier 1 cities with more developed sales forces, Toast has ~55-60% market share, indicating a high value proposition. Sales is a key driving advantage in Toast go-to-market strategy. They had over 400 more sales reps than Square and outspending competitors on sales and marketing. Toast's SG&A as a percentage of revenue is ~16% vs 12% for Block. "And we were able to capitalize on [our product’s advantages] by really extensively investing and building out our sales force to a point where potentially at Toast, we had more sales reps than the entire industry combined," said a former sales director at Toast.
Toast has a growth-oriented sales model and Gillette-esque sales strategy. The negative hardware gross margin is offset by high margin software sales and recurring transaction fees given high switching costs. The negative margin still beats out competitors indicating operating leverage advantages. The $700 ASP is consistent with competitors, but Toast has higher hardware margins.
Figure 6 - Toast's advantages enable it to charge more for hardware
Toast’s lower CAC is owed to its better-targeted SMB offering. Unlike its competitors (Square, Clover, Lightspeed) who focus on firms across verticals, Toast has focused on the restaurant industry with specific features, such as inventory management, QR code payment, and delivery services. Thanks to the tailored offering, Toast boasts of a~80% win rate vs peers. Competitors confirm this. A VP of SpotOn, one of Toast’s competitors, said that "even if [our customers] were happy, when Toast came in and made a compelling pitch … I would say we probably lost 75% of the time where they would go to Toast." The testimonial demonstrates Toast’s ability to capture market share without competing strictly on pricing.
Thesis 2.1: StratEx acquisition is highly accretive to ARR
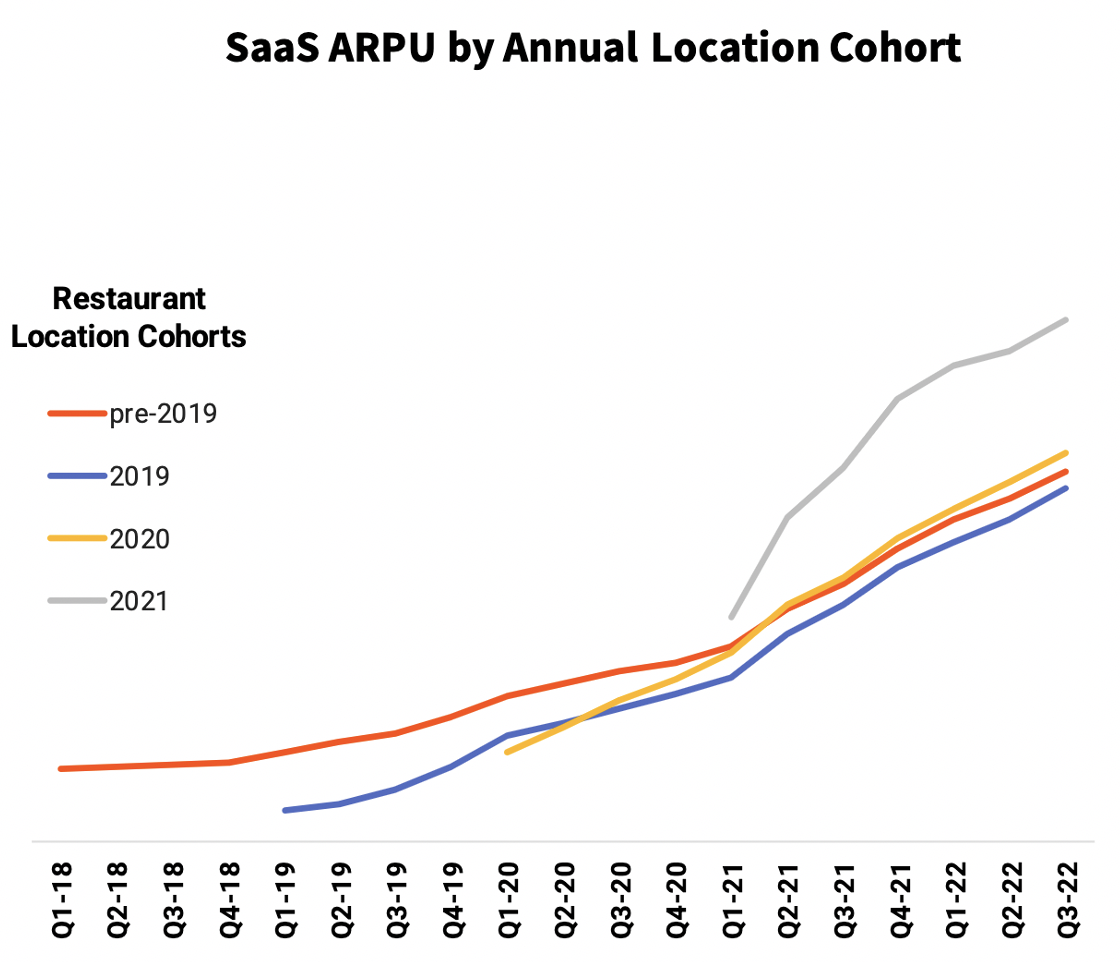
Toast’s acquisition of StratEx (now Toast’s Payroll module) in 2019 created significant ARPU uplift opportunities as attach rates increase.
Figure 7 - Toast's ARPU has been increasing both within cohorts and on a cohort-by-cohort basis
Overall, Toast's Q1 '22 earnings show high growth in their payroll attach rates, with 30% for new bookings compared to 15% in Q1 '21. This indicates a high value product with fast adoption growth. Additionally, net add-on sales for newly opened restaurants are around 30- 40%, indicating significant whitespace still available for growth. With these high growth figures, Toast projects a significant impact on their annual recurring revenue (ARR) from the payroll module. In Q2 '22, they anticipate an attach rate of around 60% for at least 4 modules.
Figure 8 - ARPU Growth is Driven by Increasing Attach Rates
Given a current ARR of around $6,000, assuming all of this is non-payroll and growth at a current 13% CAGR, and assuming payroll attach rate growth at 100% CAGR, the aggregate ARR in n years will rise from 6k to 9k in about 3.5 years. The estimated pricing for Toast's product is around $80/month, $12/employee, which can lead to $3,120 additional ARR/location per year alone, given a 15 employee restaurant.
Thesis 2.2: Toast has substantial room for take rates increases
We are bullish on Toast’s increases in take rate. The continued adoption of virtual ordering modules, such as Order & Pay and Toast Delivery Services, will drive up take rates for Toast. Card-not-present (CNP) transactions increase take rates by around 0.5% per transaction, compared to card-present (CP) transactions. Currently, only 20% of transactions are CNP, but this is set to increase in the coming years due to attach rate increases to CNP modules. The adoption rate for Order and Pay is around 10%, while Toast Delivery Service (which is an older module) is now at around 75%. There is no reason not to see Order and Pay adoption rates rising similarly, given the trends for QR code ordering and labor shortages. As CNP module attach rates grow, take rates will move from around 0.5% to around 1%.
Figure 9 - Toast has already increased take rates
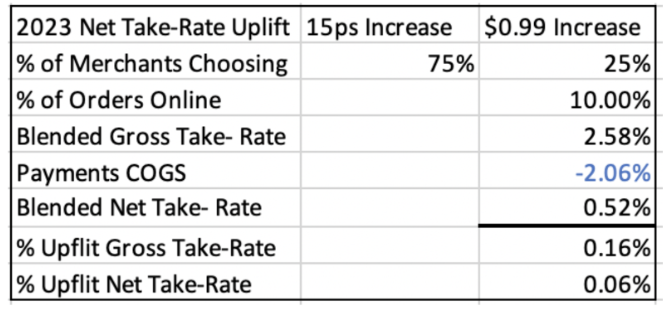
Take rates have already increased with virtually no analyst coverage. Starting December 1, 2022, Toast emailed customers and informed them that restaurants either had to:
accept a 0.15% increase per transaction, or
avoid the increase in the interchange rate if the restaurant accepts a $0.99 fee per online transaction paid by the customers of the restaurant.
The second option is even more attractive for Toast. The average online volume is around $32 dollars; the option would represent a 3% gross take rate on online orders. The change could generate a 16 bps uplift down the line, resulting in a 6 bps higher take rate than the 0.5% take rate that majority of sell-side analysts are flatlining.
Figure 10 - Effect of recent take-rate increase in 2023
Valuation
Our valuation of Toast is driven by several key value drivers. Firstly, we anticipate strong growth in the number of locations, with a projected CAGR of 21%. This is driven by an increase in coverage of new add opportunities, a consistent win rate, and a growing share of restaurants utilizing cloud-based point-of-sale systems.
Another key driver is the growth of gross payment volume (GPV) and take rates. We anticipate GPV per location to grow in line with inflation at a rate of 2% per annum. Additionally, we expect to see a 16 basis points uplift in net take rates, coupled with an increasing share of card not-present (CNP) transactions, resulting in a projected CAGR of 1% for take rate growth.
We also expect to see strong growth in services revenue, driven by an increase in payroll and supplementary product attach rates, resulting in a projected CAGR of 13% for annual recurring revenue per location. The Toast Capital and Restaurant Card offerings are also expected to contribute to this growth, with projections of capturing 10% and 2% of loan volume and cost of goods sold (COGS) respectively.
In terms of margins, we anticipate a 6 basis points uplift in net take rate and a higher share of CNP transactions to drive margin expansion. Services margins are expected to remain steady, while hardware and professional services will continue to be loss leaders with gross margins of - 40% and -350% respectively. Furthermore, we expect R&D and G&A expenses as a percentage of sales to decrease with scale, similar to that of Square.
Figure 11 - Valuation Assumptions
Using a weighted average of Vertical SaaS (12.5%), Restaurant PoS (75%), and Commerce Facilitators (12.5%), we arrive at a 6x gross profit 2026 exit multiple for Toast.
Overall, we believe that the company's strong growth potential and key value drivers make it a compelling investment opportunity, with a base case IRR of 18.1% at a 5-year investment horizon.
Figure 12 - Valuation Outcomes
Risks & Mitigants
1. Rise in Payment Processing Fees
Increase in COGS take rates cutting directly into net take rates and gross profits
Quantitative Impact:
25% gross profit CAGR with 2 bps. p. a. increase in COGS take rates vs 27% base case gross profit CAGR
Upside 85% compared to 102% in base case
Qualitative mitigants:
Toast scaling in volume should help it get greater rebates from card networks, bringing its take rates closer to comps
Toast recently diversified its card processors; now has two instead of one
Toast was able to pass Visa & Mastercard’s ~0.10% increase in card network fees in April 2022 to its customers, increasing net take rates in the process
2. Recession
Causing decline in GPV per location
Negative new locations growth
Willingness to spend on new modules crimped
Quantitative Impact:
0% growth in services, GPV per location and -1% new locations in 2023-4
55% and 34% gross profit growth in 2023-4 vs. 60% and 37% growth in base case
Upside 80% compared to 102% in base case
Qualitative mitigants:
The restaurant industry has shown surprising resiliency in 2008-9
Figure 13 - Restaurant performance in 2008-9
3. Increased Competition
Competitors under-cutting hardware costs and take rates
Would force Toast to further lower hardware selling costs
Might force Toast to offer lower take rates
Quantitative Impact:
-2.5 bps. gross take rate growth, -40% hardware margins and -400% professional services margins
23% revenue CAGR and 31% gross profit CAGR and vs. 24% and 32% in base case
Upside 73% compared to 102% in base case
Qualitative mitigants :
Toast outcompetes in vectors other than fees
Toasts’ customers are contract-locked for 1-3 years
Competitors already offer $0 upfront hardware, not leaving room for undercutting
Horizontal SaaS players won’t be willing to cut restaurants take rates
Higher competitor net take rates are partially thanks to higher rebates, lowering gross take rates would cut into competitors’ revenues and increase their COGS


